The Indian Cement Industry has been a front runner in adopting state of the art technology, innovative process improvements and resilient business practices. It has been building sustainable societies for the future. Cement manufacturing is an energy intensive process – any step/(s) that leads to improving energy efficiency establishes the prowess of the cement companies. Input energy represents almost 30% to 35% of the overall expenses towards manufacturing cement thereby making it critical for the industry to explore latest technologies and alternative ways of becoming energy efficient. Such transitions could be streamlined through an enabling policy environment and complementing regulations aligned to sustainable development.
Energy efficiency in a cement plant is measured as a combination of two factors, viz., Thermal Energy Consumption and (2) Electrical Energy Consumption. The former specifically measures the kiln performance while the latter measures the overall performance of the plant.
The fundamental process of manufacturing cement has remained consistent over a period wherein limestone is heated up to a temperature as high as 1450 degree Celsius. Most of the upcoming future prospects such as alternative binders and carbon cured cements are in initial stages of development and are not seen as a promising replacement owing to the behemoth scale of the industry. The theoretical demand of energy for clinker production varies between 1,650 to 1,800 MJ/t clinker. Additionally, about 200 to 1,000 MJ/t clinker of energy is required for drying of the raw materials before Calcination. The average annual fuel energy requirement of a representative state of the art cement kiln based on theoretical modelling and empirical data is estimated between 3,000 to 3,400 MJ/t clinker for six cyclone stages and 3,100 to 3,500 MJ/t clinker for five cyclone stages.
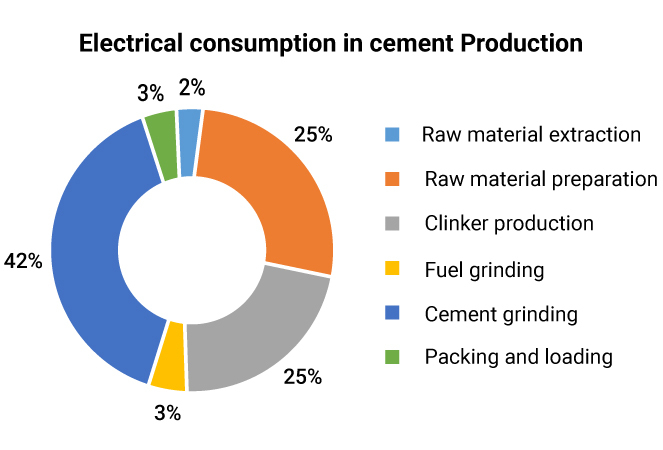
Figure details the electrical energy demand of the cement process as about 2% for raw material extraction, 25% for raw material preparation, 25% for clinker production plus an additional 3% for fuel grinding, 43% for cement grinding and 3% for packing and loading.3
Some of the thermal energy efficiency measures and emission control systems adopted in clinker production may inversely impact the electrical energy consumption. For example, the installation of modern coolers causes a reduction in thermal energy use but increases the consumption of electrical energy. Table details the thermal and electrical Specific Energy Consumption (SEC) in India vis a vis global peers.
| Parameter | Unit | Global Top 10%1 | Global Average3 | India2 |
|---|---|---|---|---|
| Thermal SEC | MJ/t clinker | 3,000 | 3,510 | 3,084 |
| Electric SEC | kWh/t cement | 85 | 104 | 76.6 |
The Cement Industry in India has leveraged a range of levers to strengthen its energy efficiency. Some of the prominent measures are highlighted as follows:
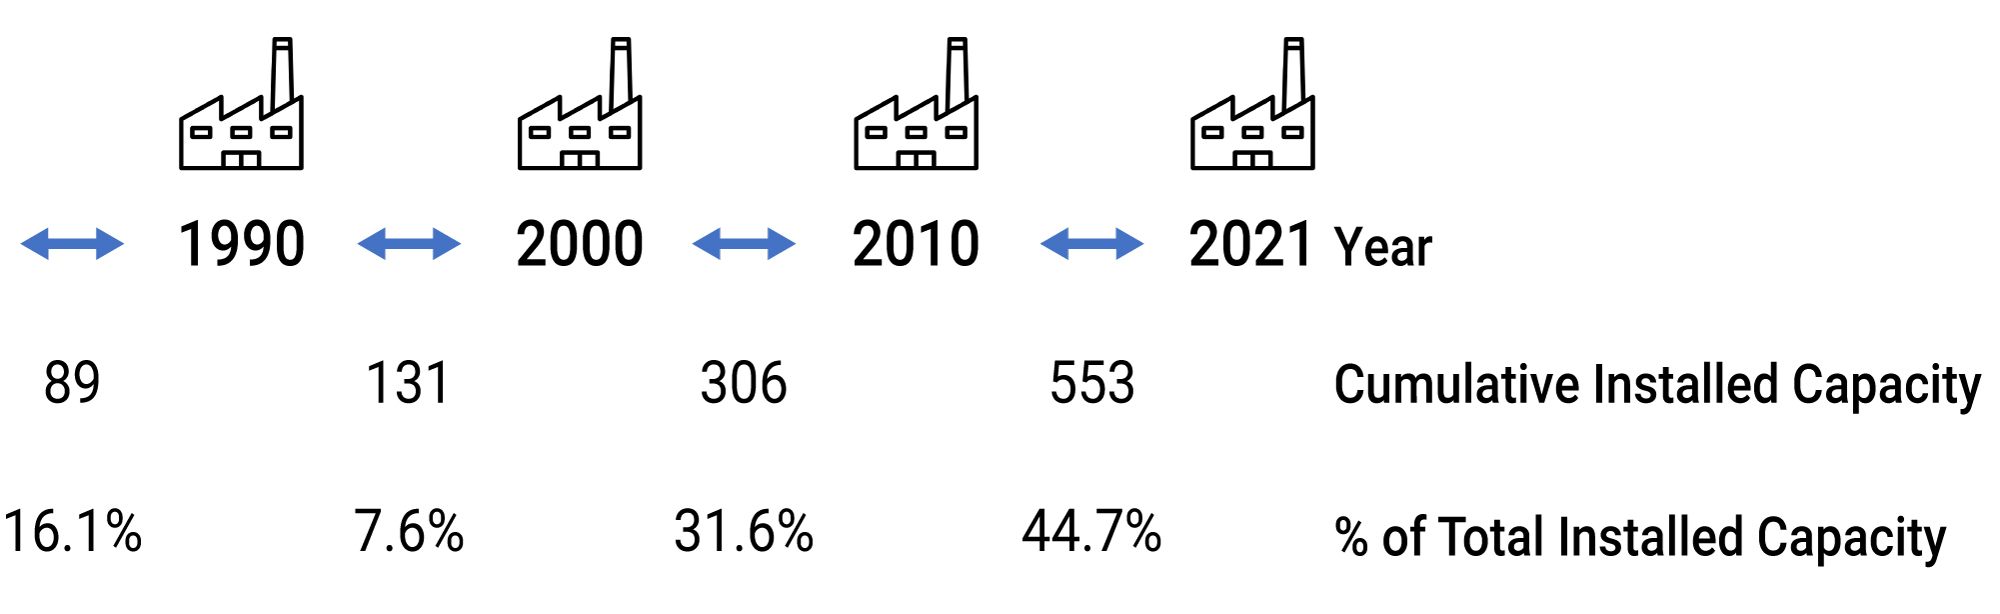
The Indian Cement Industry is relatively young compared to its global counterparts. Around 44.0% (247 MTPA) of the total installed cement capacity has been set up over the last decade and stands at par with the best in the world.
Selection of most advanced technology does not guarantee a long term sustained energy efficient operations. Over a period, energy efficiency is constantly driven by a range of process optimisation functions, such as:
ISO 50001, voluntarily adopted by a majority of Indian cement players, also ensures implementation of a structured, systematic and continuous improvements in energy efficiency. Table highlights specific electrical energy consumption rate for selected unit processes in the Cement Industry.
| kWh/ton of Material | Technology |
|---|---|
| 0.70 | Single Stage Crusher |
| 0.65 | Double Stage Crusher |
| 11.10 | Raw Mill - Vertical Roller Mill |
| 16.50 | Raw Mill - Ball Mill |
| 23.90 | Coal Mill - Vertical Roller Mill |
| 16.28 | Five Stage Preheater - Clinkerisation |
| 17 05 | Six+ Stage Preheater - Clinkerisation |
| 45.38 | Five Stage Preheater - Upto Clinkerisation |
| 43.32 | Six+ Stage Preheater - Upto Clinkerisation |
| 21.92 | Cement Mill - Vertical Roller Mill |
| 27.07 | Cement Mill - Ball Mill Closed Circuit |
| 23.20 | Cement Mill - Ball Mill with HPRG |
| 0.65 | Packing Plant |
| 0.67 | Compressor upto clinkerisation |
| 0.89 | Compressor Cement Griding and Packing |
A majority of Indian cement plants operate at an above average installed capacity of around 1.7 MTPA, which allows optimal utilisation of resources and aids in improving energy productivity.4
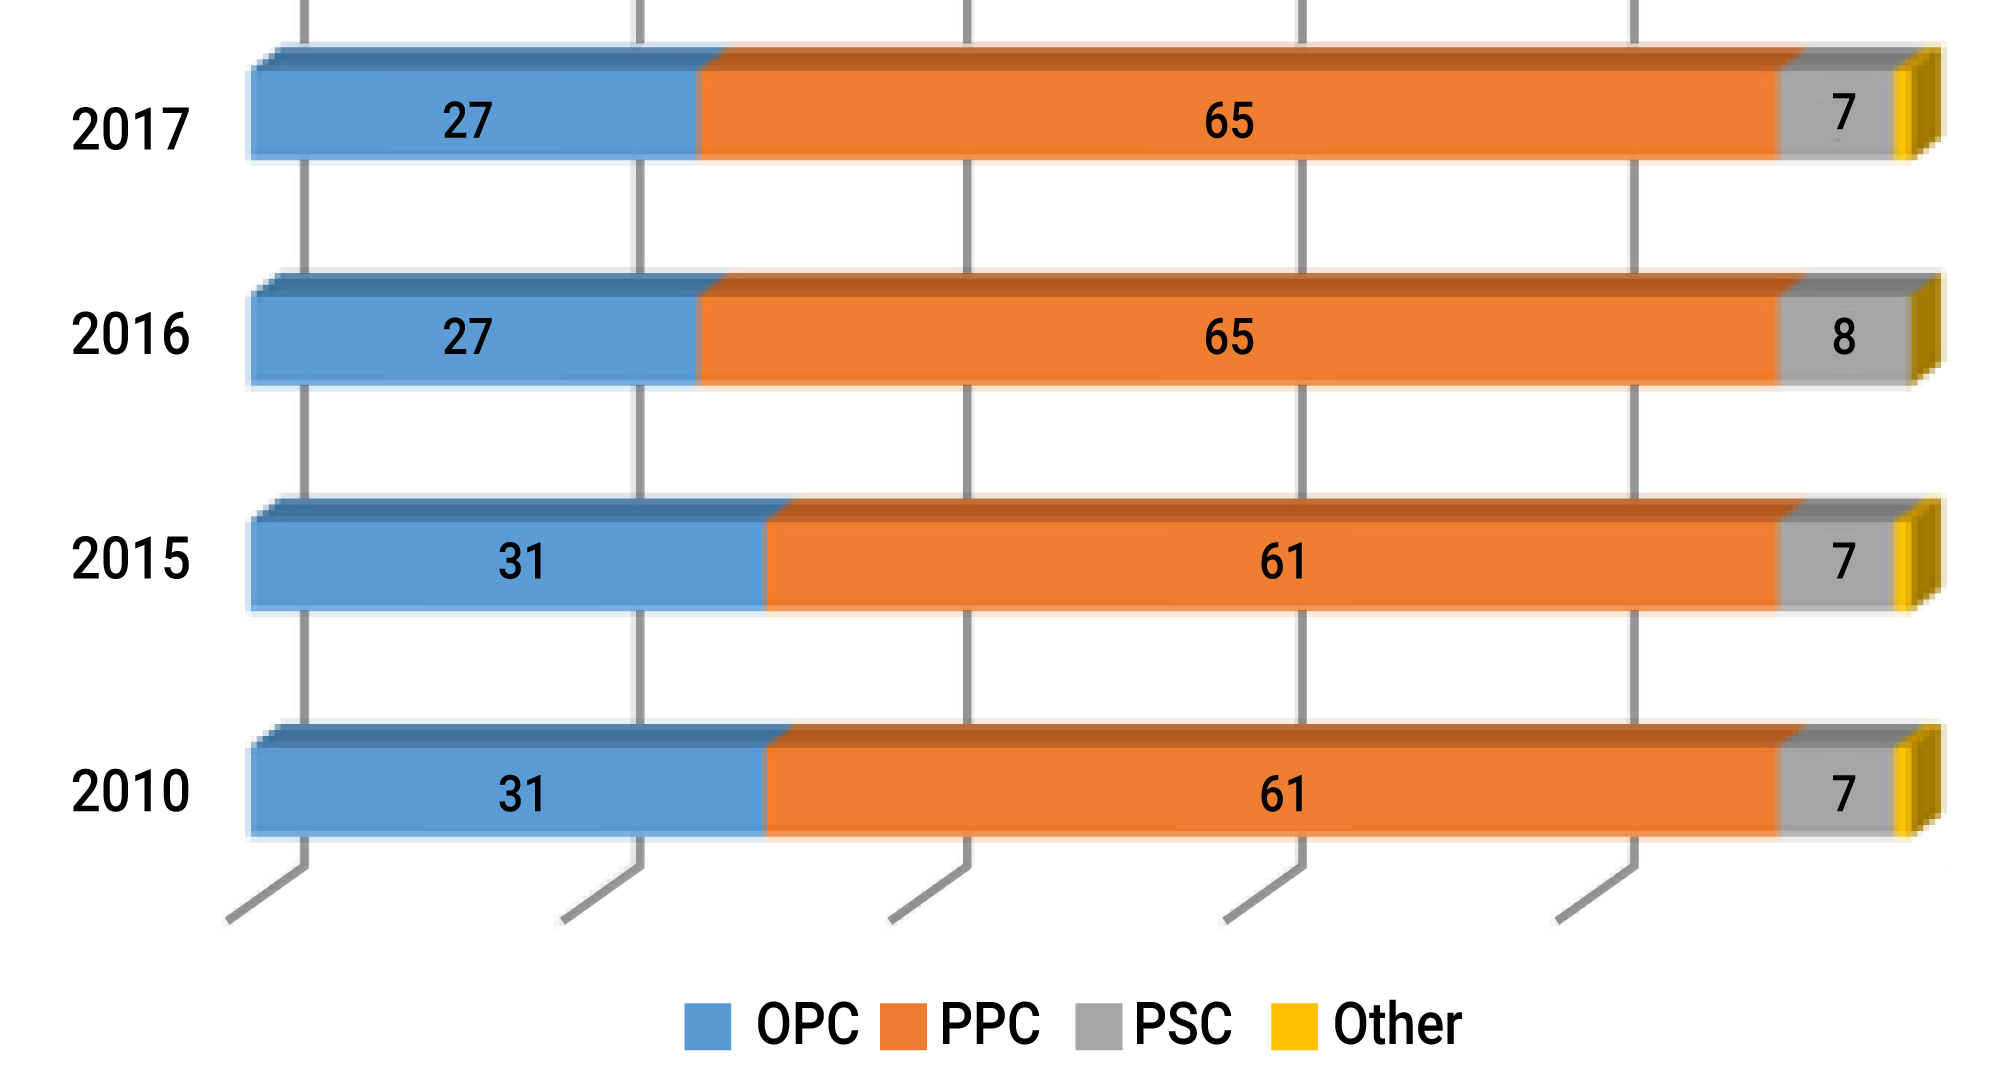
Cement Industry has gradually transitioned to greener variants of Ordinary Portland Cement (OPC). Production of Portland Pozzolana Cement (PPC) and Portland Slag Cement (PSC) contributing to a significant 72% (in 2017) of the total cement production in India ( Figure ). The Indian Cement Industry is the largest consumer of fly ash consuming about 28% of the total fly ash generated in the Country.5 Electrical energy demand also depends on the product characteristics. Higher the requirement for a cement’s strength development, finer it needs to be grinded, requiring significantly more energy in the grinding mills.
The International Energy Agency (IEA) estimates that around 3.7 GJ of energy can be saved per tonne of clinker displaced.6 Table details the Clinker to Cement ratio in India vis a vis global peers.
| Parameter | Unit | Global Top 10%7 | Global Average8 | India9 |
|---|---|---|---|---|
| Clinker to Cement Ratio | % | 65% | 75% | 69.5% |
Mineralogical and chemical characteristics of raw material/ore, such as homogeneity, removability, fragility, grindability, burnability and moisture content, affect the thermal intensity of clinker.10 Indian cement players efficiently combine high grade limestone with that of poor grade to enhance the life span of captive mines while also optimising the requirement of raw ore.
Around 4% of the total fuel requirements by the Indian Cement Industry is met through alternative fuels, primarily municipal solid waste. The inconsistency and lack of pre-treatment at the source of waste management site affects the throughput (energy efficiency) of cement kilns. A supply side segregation and pre-treatment would immensely assist in meeting higher energy productivity by the Cement Industry.
The Indian emission norms calls for stringent measures for abatement of dust (Particulate Matter), SOx and NOx emissions that require additional power from corresponding ancillary equipment(s). Estimates suggest that specific electrical consumption would further increase by 5 to 15 kWh [6] to meet the increased requirements of emission reduction and product fineness.
Energy efficiency can be streamlined through collaborative efforts amongst the Cement players, State bodies and academic institutions. Financial incentives towards adoption of state of the art technologies and energy management systems would increase the speed and scale of transition.
Perform Achieve Trade (PAT) initiative by the Government of India has been a successful driver behind transition to higher energy efficiency within the industry sector. The Cement Sector has surpassed the prescribed efficiency targets in both the cycles of PAT, which demonstrates its proactiveness and partnership in achieving cleaner growth pathways. Future PAT cycles are expected to further strengthen the energy efficiency targets for the Cement Industry ( Table ). Presently the integrated cement plants with a threshold annual energy consumption of more than 30,000 toe are included under the PAT scheme.
| Initiative | Target Set |
|---|---|
| PAT Cycle III | 0.096 Mtoe |
| PAT Cycle IV | 0.004 Mtoe |
| PAT Cycle V | 0.087 Mtoe |
The Indian Cement Industry has been able to leverage on the energy efficiency levers to optimise its energy requirement and is poised to play a critical role in transition towards sustainable development.